Have you ever wondered how volatile each App Store category is? We all know that some categories are more competitive than others, but it is unclear if the apps in these categories also stay in the top charts for shorter periods of time. Another question that arises is the difference between countries: How do they compare to each other? For a given category, would an app stay in the top 100 for a longer period of time in France compared to the US? In this blog, you’re about to find out!
We examined the top charts (free) for 13 categories and 5 countries (United States, Japan, Germany, France, Brazil) between June 1st, 2020 and May 31st, 2021. All the apps and games that ranked in the top 100 for at least one day have been taken into account.
Table of Contents
- How Long Do Apps & Games Stay in the App Store Top Charts?
- cheap ios app installs
- google play ranking factors
- dating apps case study
How Long Do Apps & Games Stay in the App Store Top Charts?
Market Share by Category
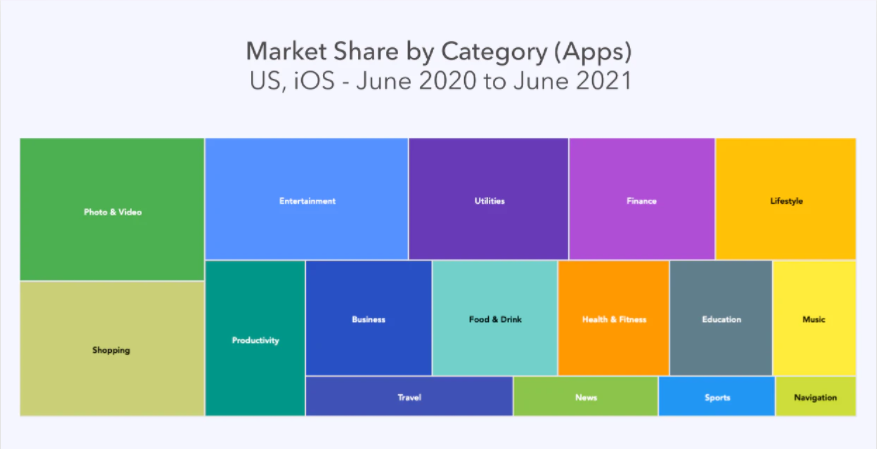
Market Share by App Category
In the US, the 3 biggest categories for apps in terms of downloads were Photo & Video, Shopping and Entertainment. They each had an estimated 11% share of downloads compared to the whole market. The following 4 categories (from Utilities to Productivity) had an estimated 7-8% share of downloads. In this analysis, we selected the categories ”All”, “Shopping” (11%), “Photo & Video” (11%), “Utilities” (8%), “Finance” (8%), “Health & Fitness” (6%) and “Education” (5%) in order to get an overview of the market and to identify whether larger categories behave differently in terms of volatility than smaller ones.
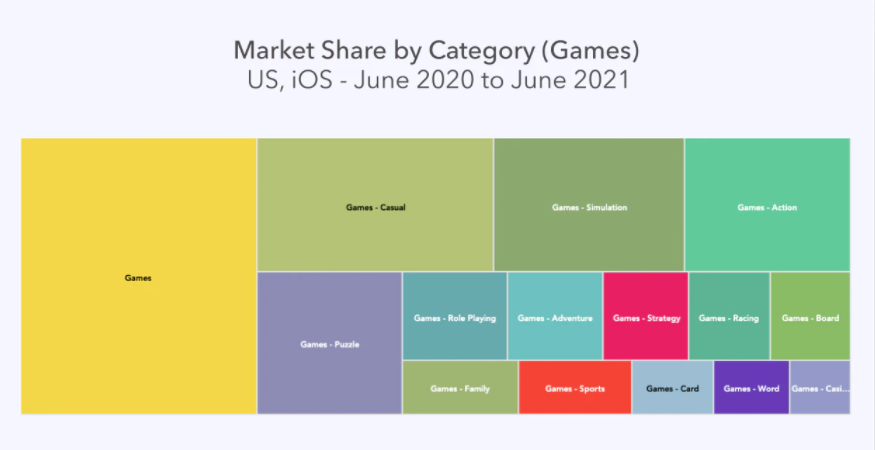
Market Share by Game Category
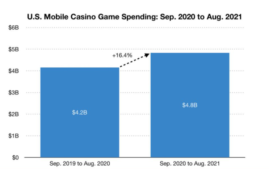
Regarding the Game categories, 4 subcategories received up to 44% of all downloads: Casual (14%), Simulation (11%), Action (10%) and Puzzle (9%). On the other hand, the category “Games” had an estimated downloads share of 28% compared to the whole market. In this analysis, we included the categories “Games”, “Casual”, “Simulation” and “Puzzle”, but also “Racing” (3%) and “Casino” (2%).
Unique Apps in the Top Charts
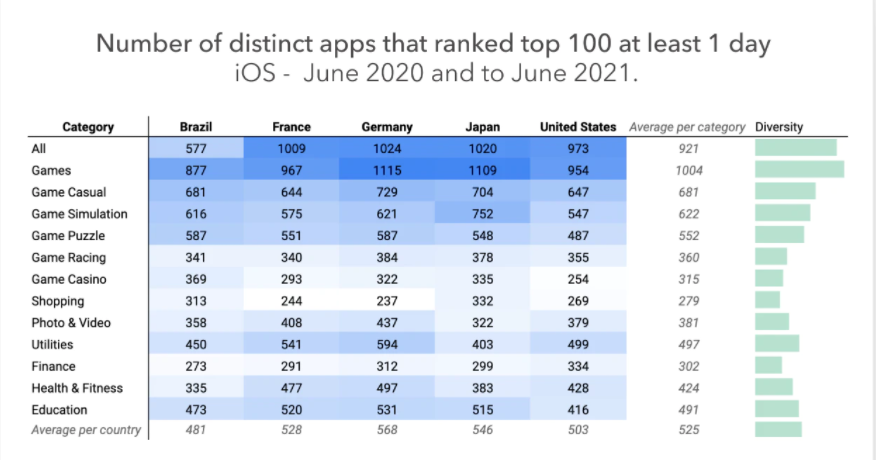
The table below shows the number of distinct apps that appeared in the top charts and ranked at least #100 for one day over the past year. Categories in which many apps ranked meant that those apps stayed in the top charts for a shorter period of time. On the contrary, categories with a low number of unique apps were more stable; apps and games stayed in the top charts for a longer period.
Unique Apps in the Top Charts
There is more volatility across categories than across countries
Between countries over the year, the average number of distinct apps in the top 100 ranged between 481 in Brazil and 568 in Germany. This means that, on average, there were fewer different apps reaching the top 100 in Brazil than in Germany; however, overall, the differences between countries were not significant. On the other hand, there was a huge difference between some categories, such as “All”, “Games”, “Game Casual”, and “Utilities”, which included a large amount of distinct apps in the top 100, and some others, such as “Game Racing”, “Game Casino”, “Shopping” or “Finance”, which were more stable and included fewer different apps on average.
Larger categories are not always more volatile
It is generally true that there are more unique apps in bigger categories than in smaller ones, especially for games. However, over the past year, there were some exceptions. For example, “Health & Fitness” and “Education” each received around 5% of the market’s downloads but they included many more distinct apps than the “Shopping” or “Finance” categories over the same period, which respectively received 11% and 8% of downloads.
Turnover is higher in the Games, All and Games Casual categories
In all countries except Brazil, more distinct apps reached the top 100 in the “All” and “Games” categories over the year than in other categories. This makes sense because new games usually rank high in general categories when they launch, but their rank quickly declines afterward. In Brazil, the category “All” was not particularly volatile. Also, “Games Casual” included more different apps in the top 100 because of its high competitiveness. “Game Casino”, “Shopping” and “Finance” were among the more stable categories.
Days Spent Within Category’s Top 100
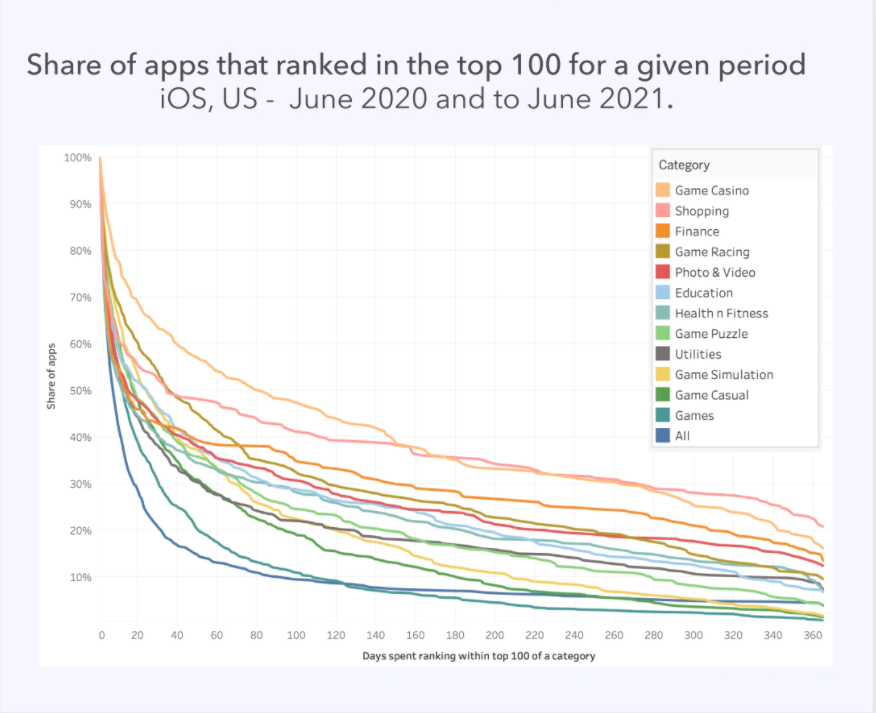
In the chart below, we took into account all the apps that ranked in the top 100 of the selected categories for at least one day over the past year. Then, we computed how long they stayed in the top 100 over that period. While all apps (100%) spent at least one day in the top charts, the share of apps that spent more days in the top charts decreased more or less rapidly, depending on the category.
For example, in the category “All”, only 30% of the apps considered spent more than 20 days in the top charts. On the other hand, in the category “Puzzle”, 50% of the apps spent more than 20 days in the top 100, but only 16% stayed for more than half a year, and 4% stayed the whole year.
Categories such as “Casino” or “Shopping” were more stable since around 35% of apps stayed in the top 100 for more than 6 months, and between 16% and 21% of apps stayed in the top charts for the whole year.
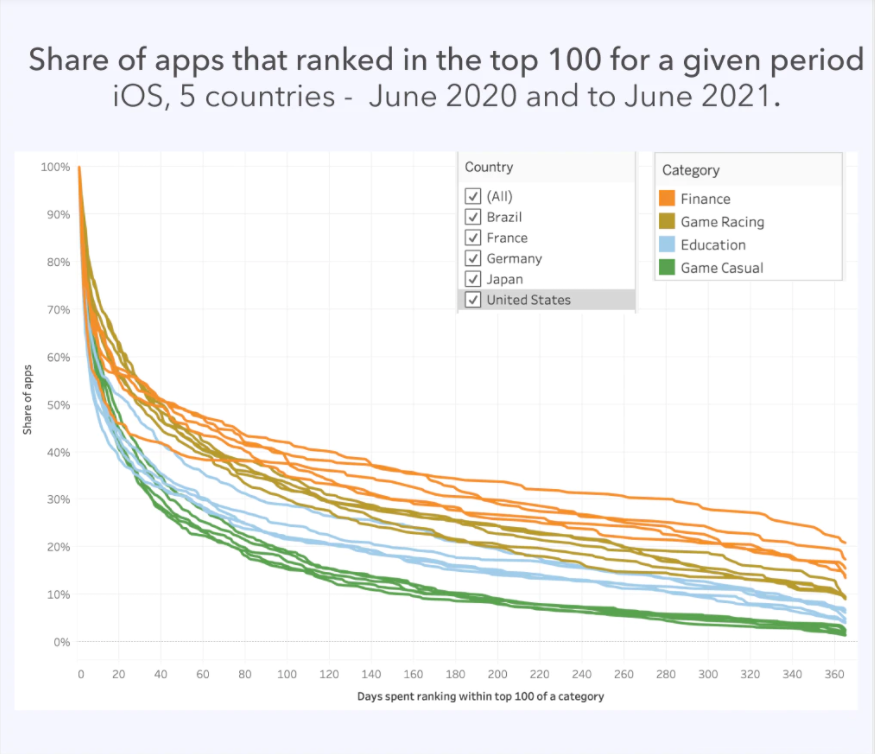
Days Spent Within Category’s Top 100
Looking at the same chart with one line per country and per category, we can clearly distinguish between the different categories while there are some minor differences between countries for a given category. Brazil was typically a bit more stable than the other countries: a higher share of apps ranked in the top 100 for a certain number of days.
higher share of apps ranked in the top 100
Conclusion
In conclusion, it is particularly insightful to consider a category’s volatility since this is not always correlated to its size. Categories in different countries usually behave similarly, and the country itself is not a very significant factor. The categories that are typically the most volatile are “All”, “Games”, “Game Casual” and “Utilities”. Among all apps in these categories that ranked in the top 100 for at least a day over the past year, less than 3% maintained their position in the top 100 for the whole year. On the other hand, in less competitive categories such as “Shopping”, “Finance” and “Game Casino”, the share of apps that ranked in the top 100 for the whole year was between 11% and 21%.